2020 Piercing Statistics
What a year. Before the pandemic began our Philadelphia studio was the busiest it has ever been. We had recently expanded our staff to five full-time piercers plus one part-time position, and were working toward opening a second location in Baltimore—Infinite’s first expansion in its entire 25-year history. Then COVID-19 happened and the whole world pressed pause. We had no idea what to expect with opening our new studio in Baltimore, and the pandemic added a whole new level of uncertainty for both of our locations, and for everyone. A lot has happened since this time last year, and as we try to make sense of everything we went back to crunch some numbers to see just how the pandemic has changed things for us over the past year. Looking back, here are Infinite Body Piercing’s 2020 piercing statistics.
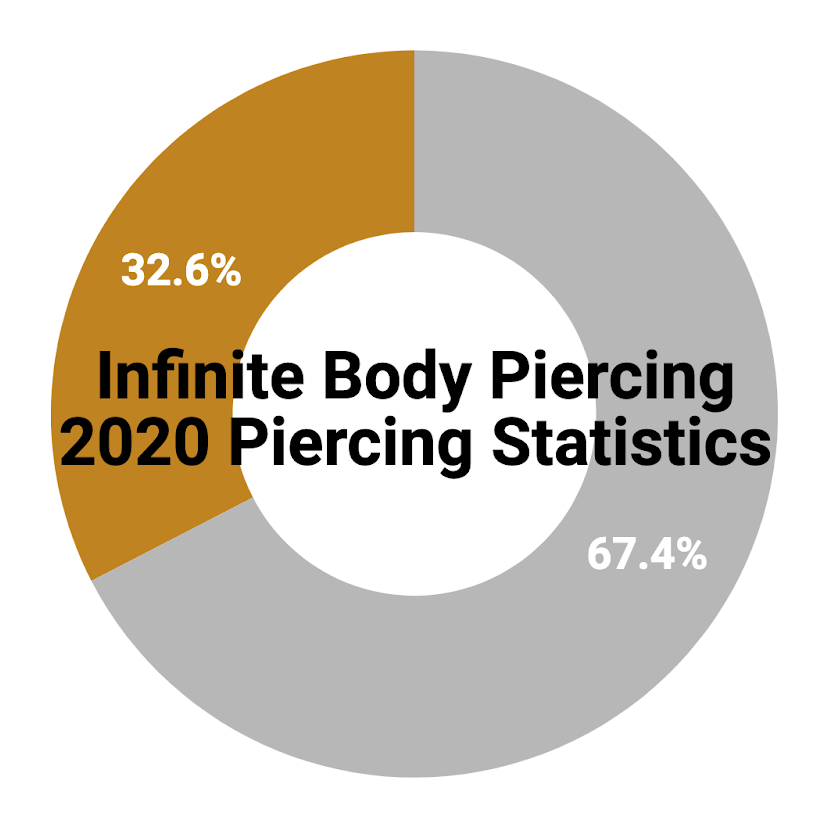
A little bit about the timeline for 2020: Before everything came to a halt the Philadelphia studio was open for a total of 75 days, or about ten and a half weeks. On March 16, we made the decision to close our doors just hours before the City of Philadelphia ordered a closure of all non-essential businesses. The shutdown lasted 102 days, from March 16 until June 25. On June 26, we reopened our doors in Philadelphia, and just under one month later, on July 24, we were finally able to open our doors to clients for the very first time at our new studio in Baltimore. Following the shutdown, we were open for business in one or both locations for a total of 189 days, or 27 weeks.
Total Piercings and Jewelry Insertions

With the 102 days that we were closed due to the shutdown, we are left with a total of 264 days open, not factoring in the occasional holiday closure—and adding an extra day for leap year. In 2020 we performed 9,231 piercings and 4,464 jewelry insertions. This means we performed an average of 35 piercings per day plus 17 jewelry changes. We pulled these numbers directly from our point-of-sale (POS) system, which documents every push of a needle, and almost every non-piercing interaction we have. The total number of jewelry insertions gives us a good idea of how many clients came in for jewelry changes, but it does not count each individual jewelry change, and it also doesn’t include those clients who don’t end up having anything rung up through the register. Some clients come in with their own jewelry or just need help taking jewelry out. Others have multiple piercings changed out which is only recorded as a single “jewelry insertion” in our system.
The biggest change in how we operated after the pandemic (besides the additional protective barriers and thorough COVID protocol) was the switch from walk-ins to appointments. Like all other businesses offering personal services, we were required to operate by appointment-only and at a limited capacity. We have operated as a walk-in only studio for over twenty-five years, and with making the switch we had absolutely no idea what to expect.
We ultimately limited the number of clients in the studio to six per hour in Philly, which was a huge difference from what things looked like just before the pandemic. Pre-COVID, it was not uncommon to walk by our studio and see several dozen people waiting in our lobby and spilling out onto the sidewalk—all this in a studio that is under 1000 square feet with only three piercing rooms. While we don’t have exact figures for how many clients we help each day, based on the number of transactions in our POS system, it is estimated that prior to the shutdown we helped an average of 65.2 people per day at the Philadelphia location, including services and basic sales. After the shutdown, with capacity restrictions plus the addition of the Baltimore studio, the average number of clients seen each day was 38.8. While this number is significantly less than what we were used to, we continue to be pleasantly surprised by (and immensely grateful to) every client who has come in to see us since the shutdown—and followed all of our COVID-19 guidelines helping to keep us and you safe.

Being closed for over a quarter of the year definitely affected our overall numbers when compared to years previous, but not as much as we thought it would. The total number of services performed in 2020 was significantly lower than the year before, but surprisingly not too far off from 2018. When comparing piercings and jewelry insertions totals by day averaged over the number of days we were open each year, we found:
| Averages per day: | Piercings | Jewelry Insertions | Total |
| 2016 | 23.9 | 10.5 | 34.4 |
| 2017 | 22.0 | 13.5 | 35.5 |
| 2018 | 28.4 | 19.5 | 47.9 |
| 2019 | 35.6 | 25.6 | 61.2 |
| 2020 (Jan 1-March 15) | 40.8 | 29.0 | 69.8 |
| 2020 (June 26-Dec 31) | 32.7 | 12.1 | 44.8 |
It’s not surprising that jewelry insertions were down significantly after we reopened: restrictions in our area included a prohibition on all services under masks, including both piercings and jewelry changes. This means we were not able to change any nostril or septum piercings, services that traditionally make up a large percentage of our jewelry change totals. Cutting back our open hours in Philly and severely limiting the number of clients in our studio had a large impact on the number of services we were able to perform last year, but opening a second location in Baltimore midway through the year brought the totals back up.
Total Piercings by Type

Despite being closed for three and a half months, we still came surprisingly close to keeping pace with previous years. Just like in 2019, earlobe piercings took first place at a whopping 2,752 total piercings. Excluding the time that we were closed, that breaks down to almost 73 individual earlobe piercings per week, or about 10 per day. Next up were helix piercings coming in at 1,670, followed closely by nipple piercings at 1,586. We were shocked to discover that we did so many nostril piercings in the first two and a half months of 2020 that they still made it into fourth place, with at 495, or approximately 46 per week for those two and a half months, or approximately 6.6 per day. In fact, both nostril and septum piercings, which were only performed from January 1 through March 15, still made it into our top ten piercings for 2020.
Unsurprisingly, the vertical clitoral hood piercing was our most popular genital piercing by far last year with 27 performed in the two and a half months prior to the shutdown and 116 in the six months afterward. Over the whole year, vulva piercings ranked from most to least popular were the vertical clitoral hood, outer labia, christina, inner labia, triangle, horizontal clitoral hood, with princess albertina and clitoris piercings tying at the bottom with three of each performed in total. For penis piercings, frenum piercings came in first, followed by Prince Albert, guiche, scrotum, apadravya and ampallang piercings.
Before the Shutdown vs. After the Shutdown

The biggest story of our 2020 numbers was the differences in specific piercing numbers from before and after the shutdown. Most of the piercings on our top ten list from before the shutdown matched the top ten list from the full year, but in a slightly different order.

After the shutdown, you still see a lot of the same piercings as before in the top ten: earlobes, nipples, helix, conch, tragus, rook, daith and forward helix piercings. What is conspicuously absent are nostril and septum piercings. Navel piercings jumped up to seventh place, and vertical clitoral hood piercings made it to the list as well.

Before the mandatory shutdown in Philadelphia, our piercing totals by category looked about on track to follow the same trends as 2019. Over half of the piercings we performed were ear piercings, followed by facial piercings, which made up just under one quarter of all services. Facial piercings include bridge, eyebrow, nostril and septum piercings, but their popularity was largely due to nostril and septum piercings, which accounted for 703 of the 742 facial piercings in early 2020.

On reopening, ear piercings jumped to 71% of all piercings performed at our studios, with a total of 4,294 piercings. This means on average we were making a new hole in an ear approximately 22.7 times per day, every day. Our most popular ear piercing was consistent both before and after the shutdown: earlobes. We performed 806 prior to closing and 1,946 after reopening. The other ear piercings in order from most to least popular after reopening were: outer helix, conch, tragus, rook, daith, forward helix, flat, industrial, anti-tragus, faux-rook, and snug piercings.
We were really trying to make 2020 Year of the Bridge Piercing, but based on the numbers the most significant change we saw was an increase in nipple piercings: before the shutdown nipple piercings accounted for approximately 11% of services performed; after the shutdown they made up over 20%, or one in five of all piercings. Over the whole year, 164 of these were single nipple piercings (just one nipple pierced), and 1,422 of them were done as a pair. We still did more bridge piercings than ever (39 total, compared to 24 in 2019, and less than 10 per year each year prior) but it looks like 2020 was officially Year of the Nipple—and we are not at all mad about it.
We were open for a total of 27 weeks in 2020 after the shutdown. This means that on average every week after reopening we performed 159 ear piercings, 46 nipple piercings, 9.5 genital piercings, 5.5 navels, 4.6 surface piercings, and 3.5 facial piercings (bridges or eyebrows). Again, what a year!
Under-the-mask Piercing Totals

This last chart, comparing 2020 numbers to 2019 for all piercings located under masks, clearly shows the impact COVID restrictions had on our piercing totals. We are at the one-year anniversary of the day we decided to close our doors in Philly. At the time we thought we would be closed for a period of two weeks—an idea that we can’t help but darkly laugh at now. Two weeks turned into three and a half long months, where the majority of our staff was at home in quarantine, and just a few of us were frantically holding things down in the studio. We fell into a groove during those months doing everything in our power to help our clients while not being able to see them in person. We took that time to do what we could, expanding our online store to include our entire in-store inventory, and enlisting some of our staff in helping with projects from home. While our piercers were sidelined, our online store sales exploded. During the three and a half months of the shutdown, we shipped out almost the same number of online store orders than we did in all of 2019. We're excited we were able to expand our online presence, and help adorn people who wouldn’t normally be able to visit us in person.
It’s important to point out that, while we are breaking down our piercings into numbers, each of these numbers represents a unique experience of individual people. Like many of our clients, I got the urge for a nostril piercing right when businesses in our area were ordered to close. Like many others when under-mask services were prohibited after we reopened, I reassessed my piercing plans and decided to get something else pierced in the meantime. On the very last day of 2020, I got my tragus pierced by Infinite guest piercer Brooke Bittens. (Shoutout to Noorann and Pixie who also got pierced that day!) For me, this experience was not only a way to mark the passing of a specific period of time, but it has also been therapeutic in ways I didn’t expect. My new piercing is still not fully healed, but it feels a little bit better each day, and each time I catch a glimpse of it I’m reminded of just how much I love it, and I feel a little more me. So as much as we can break down all of these piercings into numbers and statistics, for those who are pierced, and oftentimes for those who are doing the piercing, in the end it results in a very personal experience—and anything that can bring a little joy out of a year like 2020 is definitely welcome.
Comments
Leave a comment